Of the many areas of focus for the engineering department at the Wikimedia Foundation, we constantly strive to improve the performance of Wikipedia and all of our projects.
In some cases, this means architecture changes, such as preparatory work to implement LUA as a template scripting language or the continual behind the scenes work of the Operations team to improve our network, server, database, and content delivery infrastructure.
But to make targeted improvements and to identify both success and regression, we need data. Lots of data.
Profiling MediaWiki
Since late 2005, MediaWiki has included support for profiling itself and sending out UDP packets of that data with a corresponding collector written in C by long-time volunteer Domas Mituzas. A simple web front-end provides sortable aggregates of that data, great for identifying which functions are called the most, and their average wall clock time.
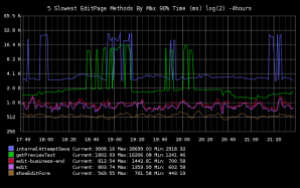
What we lacked was a system for tracking this over time, or for getting a finer-grained view than just averages, which tend to mask performance issues that only surface on certain pages, or are periodic.
We’ve also needed a way to identify performance issues within specific portions of our application, and to assess the impact of new code releases. With inspiration from Etsy’s statsd, we added bucket sampling to our original collector (allowing calculation of Nth percentages) and we wrote a python daemon that feeds call rate and timing data (average, 50th, 90th, and 99th percentiles) into graphite, a real-time graphing system with a custom data format for time-series data.
We generate profiling data on about 2 percent of requests hitting MediaWiki, and also send UDP packets to the collector every time the wfIncrStats() function is called within MediaWiki (allowing developers to easily graph or track anything with a single line of code.)
Pretty Graphs
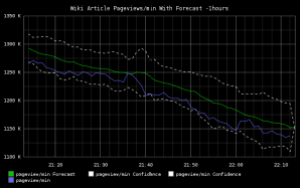
We are currently tracking over 30,000 metrics in graphite, including near real-time request data from our front-end caching layer (excuse the once daily drop-off that will be fixed with pending improvements to our logging infrastructure).
We’re talking about a lot of data, from which we’ve assembled a smaller set of public dashboards accessible at gdash.wikimedia.org.
We know we have major work ahead of us to improve performance pain points experienced by our community of editors, and data will guide the way.
Asher Feldman
Performance Engineer
Can you help us translate this article?
In order for this article to reach as many people as possible we would like your help. Can you translate this article to get the message out?
Start translation