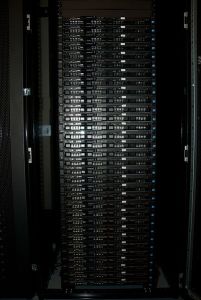
Last week, you read about how Wikimedia Foundation’s Technical Operations team (“Ops”) spent hundreds or thousands of staff hours to refactor and automate all the services it provides, to prepare for the January data center migration. One reward from that work: our sites were not down as often, and when they were, downtime was for better reasons.
“Another thing that illustrates our growth and maturity is our downtime,” says Operations engineer Peter Youngmeister. “Something that’s less visible to people outside of Ops is the kind of downtime we have. For example, we no longer have much downtime of the variety of ‘Oops, bumped that cable’ or ‘That one box died,’ because things are much more robust now, much more redundant. A lot of that is a product of the massive automation push we’ve been going through, which lets us create redundancy far more easily, and lets us spend our time not fighting fires.”
Wikimedia Foundation engineer Roan Kattouw adds: “Or, ‘the master DB server has a full disk’ — that one happened a few times a few years ago, and doesn’t happen any more now.”
To fix crises fast, we need monitoring: tools that automatically check for problems and alert our engineers when something is broken. In the very early days of our sites, we simply trusted that there would usually be a sysadmin online and available in case someone noticed a problem and complained on IRC. Several years ago, we began to use Nagios for monitoring and assigned a “pager duty” rotation to decide who might be woken up by a crisis.
Nagios runs coarse automated tests on the behavior of our site (such as “Does port 80 return an HTTP 301?”) and checks certain key numbers to make sure they’re within the desired range (for instance, to test whether we’re running out of memory). If a test fails, Nagios sends out email, IRC, and SMS alarms.
Monitoring helps us address the crisis faster, but it often doesn’t help with the actual problem-solving.
“Nagios is great for telling you when things are broken, and crap for telling you why,” Peter explains. “The work that Asher Feldman has done creating profiling data is more useful.”

As Roan puts it: “Profiling is the act of generating data on ‘How much time does large task X spend doing small subtask Y?’ The reason for that is that 1) one of those small Ys might actually be not so small, and be a problem, and 2) per the 80-20 rule, for some Ys, optimization will have a larger impact, so you wanna find those.” Profiling generates knowledge about the behavior of our systems, so that engineers can better understand how the cluster should be operating, and offers data points for troubleshooting.
We use two profiling systems to get time-series performance data: Ganglia at the “host” level, and Graphite at the “application” level (get a Labs login to see Graphite). In the past two years, we’ve configured Ganglia to cover much more data, and in 2012 began to use Graphite. The better data makes it more useful for troubleshooting, and Director of Operations CT Woo regularly checks the dashboard to look out for upcoming problems and alert his team. This reduces downtime.
For example, on one ganglia page, we previously only had access to host data: free disk, load, etc. We have recently added the Apache-specific data, such as requests per second and number of idle threads. This additional information aids sysadmins in troubleshooting. “One can look at it and make better deductions than just ‘Yup, server’s under a lot of load…’,” explains Peter.
Like puppetization, improvements in profiling were an investment by the Ops team. “There’s a plug-in for Ganglia that does Apache performance stats. It took me a couple of hours to set it all up. But, again, that’s being forward-thinking, debt that we had to work off instead of just cursing ourselves when it wasn’t there when we needed it. It’s a massive undertaking to decide to do things The Right Way, set up a platform, instead of doing a million one-offs.”
While puppetizing and improving monitoring and profiling to prepare for the data center migration, the Operations team had to defer other non-urgent work. “Ops was less able to give support to many teams,” says Peter. “For example, Fundraising just had a couple of boxes and could do whatever they wanted on them, as opposed to now where [Operations Engineer] Jeff Green is working on making an awesome, PCI-compliant system with them full time. Or, Analytics was very independent/unsupported, because there were so little human-hours to give to supporting things that weren’t just keeping the site up… I think that the EQIAD [Virginia Data center] build-out is very demonstrative of the amount of [technical] debt that Ops was in.”
Now, Peter is looking forward to seeing Wikimedia “spin up more data centers dramatically more quickly.” The Operations team is making preparations for an additional data center on North America’s west coast. Site Architect Asher Feldman sees a “continuing arc of refinement” in the team’s future, rather than “challenges that end, to be replaced by new ones.” “The challenges of making MediaWiki scale aren’t going to go away any time soon; nor will the need for incremental architecture modernization at multiple levels.” For instance, Ops needs to continue puppetizing certain services; some modules also need their Puppet manifests tweaked so that they work not just on the main site, but also in Wikimedia Labs.
You can check out the Operation’s team 2012–2013 goals to find out more about what’s next (including improvements in search and security).
Sumana Harihareswara, Engineering Community Manager

Can you help us translate this article?
In order for this article to reach as many people as possible we would like your help. Can you translate this article to get the message out?
Start translation