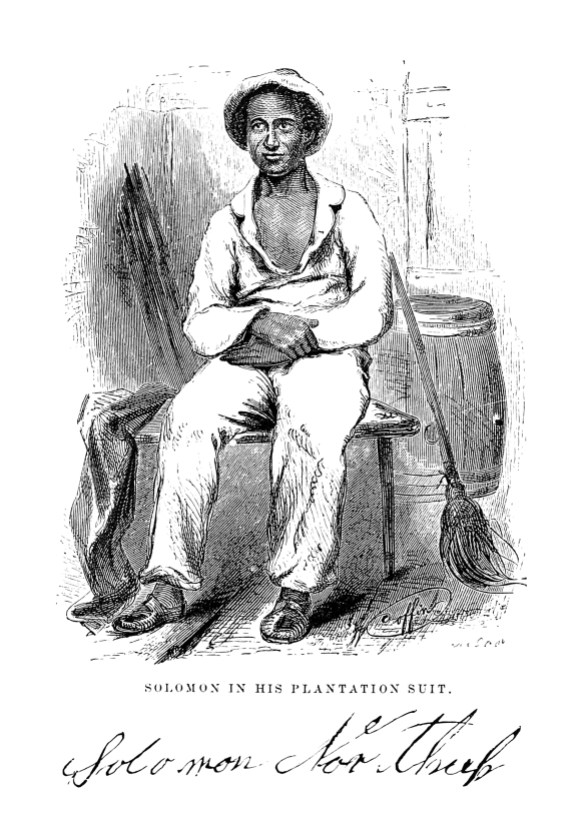
Solomon Northup was the most-visited Wikipedia article on December 12, according to HatNote’s Top 100—a new app that takes advantage of the new pageview API. Illustration from Twelve Years a Slave (1853), public domain.
Wikipedia and its sister projects receive more than 16 billion pageviews each month—more than double the earth’s population. The popularity of different Wikipedia articles can reflect trends in society if we ask simple questions: what’s more popular on Spanish Wikipedia, fideuà or paella? How many views did Punjabi Wikipedia get after the last editathon? What are the top destinations people look up on German Wikivoyage?
You can now use the Wikimedia Foundation’s new pageview API to get these answers quickly and easily.
Until recently, the best way to get these answers was to download large data dumps and crunch the numbers yourself, or manually compile the numbers from Henrik’s stats.grok.se. This data didn’t differentiate between web crawler and user views, and didn’t have mobile views. With the new API we solve those problems and guarantee performance and stability. We want to empower our communities to build tools that make the wiki universe more fun and interactive.
Some community members are already working on interesting tools. HatNote, a collection of wiki-centric apps, now shows a fascinating display of the most popular articles each day with lead images and text blobs. It is a mesmerizing view into what is trending and draws you down the knowledge rabbit hole. TreeViews is a tool recently updated to use the new data. It lets you analyze pageviews for given categories. This is especially useful for individuals involved with galleries, libraries, archives, and museums (“GLAM“), as it allows them to assess the success of posting high quality, archive worthy content to Wikimedia Commons. The Research team is working on recommending important articles for translation or creation: they find out which articles are popular in one wiki but don’t exist in another using Wikidata and the pageview API. The Graph extension is a fun way to visualize data on a wiki, and it’s been made to work with the API as well.
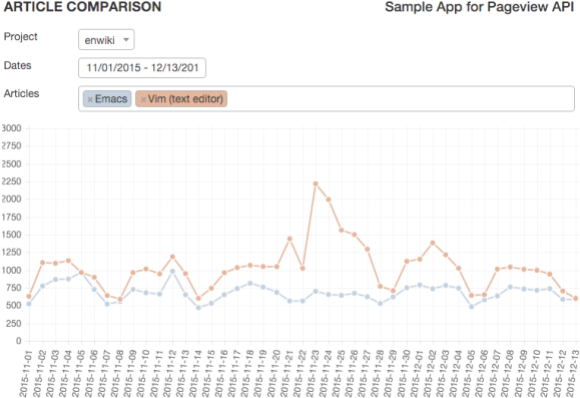
If you’d like to play with the data, we’ve made a demo app to compare pageviews for articles over time. You can look at emacs vs vim or how attention was drawn to the Beirut and Paris articles in the aftermath of the recent bombings.
Editor’s note: a standard app is now available.

Screenshot, CC BY-SA 3.0.
This pageview API has been long in the making, and its history may be relevant to future projects. Members of the community, and especially people involved with GLAM, have been asking for ways to query this data for over a decade. While the Wikimedia Foundation—the non-profit that supports Wikipedia and its sister projects—would release raw data dumps, stats.grok.se was the only way to query it until now.
Wikimedia Foundation realized this was an important community ask, but did not prioritize the project for two main reasons: the infrastructure wasn’t ready and demands for other metrics were too high for the small team. When we started thinking about this project on the Analytics team, it became apparent that we needed to change our infrastructure. This took our small team about two years to work out all of the problems. Once the infrastructure was up in October 2014, we immediately made the more reliable raw data available, but the pageview API again took a back seat to other projects such as Event Logging and helping to monitor Wikipedia’s visual editor. Given the great feedback we’ve received since launching it, we are adjusting our process to more closely work with our communities.
Andrew West, a senior research scientist at Verisign Labs, told us that “Page view data has long been available, and the researchers with the capability to parse and interpret that tremendous volume of data have produced impactful results. That said, a public API that abstracts away those difficulties will enable access to a new class of editors, programmers, and researchers whose diverse perspectives will yield novel ways to analyze and utilize page view data.”
We believe in what he says and sincerely hope you’ll be part of that discussion on our IRC channel (#wikimedia-analytics on freenode.net), any MediaWiki event such as the upcoming developer summit, and our task tracking tool, Phabricator, where we have feature brainstorms like this. This API is just the beginning. We’re working on opening more pageview data and editing data in ways that maintain privacy and are as easy and fun to use.
Technical Details
The API is built on a RESTful architecture making it easy to retrieve data with a URI. The Services team built RESTBase, which makes it easier to deploy projects like the pageview API. You can immediately start playing with the API by filling out this form and seeing what kind of URIs the API uses and the results returned. Our Quick Start guide shows additional HTTP endpoints for different sources of data.
To make it easier to use, we have an R client and we’ve just released a python client. You can install it with pip (pip install mwviews) and use it like this:
p = PageviewsClient()
# Fideuà vs. Paella on Spanish Wikipedia
p.article_views(‘es.wikipedia’, [‘Fideuà’, ‘Paella’])
# Views on Punjabi Wikipedia for August 2015
p.project_views([‘pa.wikipedia’], start=’20150801′, end=’20150831′)
# Top articles on German Wikivoyage
p.top_articles(‘de.wikivoyage’, limit=10)
Dan Andreescu, Software Engineer
Wikimedia Foundation

Can you help us translate this article?
In order for this article to reach as many people as possible we would like your help. Can you translate this article to get the message out?
Start translation