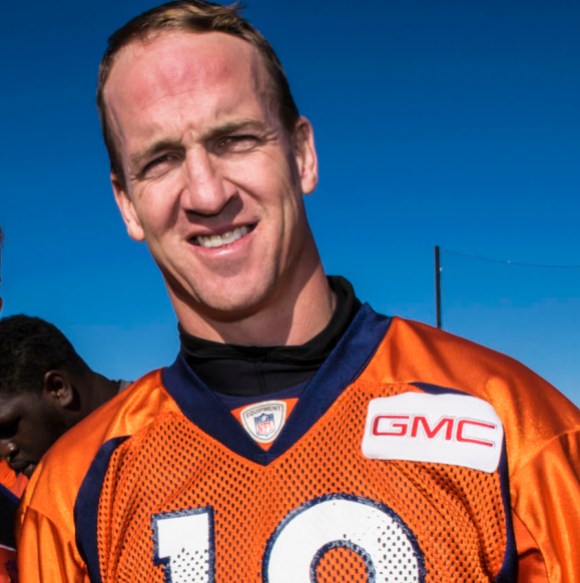
Peyton Manning was one of the most-searched articles on the English-language Wikipedia during and after the Super Bowl. Photo by the US Air National Guard, public domain.
On Sunday evening, the most valuable player of the Super Bowl—the US’ biggest sports event—was announced: Von Miller.
Who?
The Denver Broncos linebacker was not a household name, unlike the two quarterbacks in the game, Peyton Manning and Cam Newton. So out came viewer’s mobile phones, and up came his Wikipedia article.
In the minute after Miller was announced as MVP, his article received 41,000 clicks, or 683 a second. The position Wikipedia played in the Super Bowl was clear: second screen.
Anticipation for the game, which is the NFL’s final contest each year, was high. Before, during, and after the game, the Wikipedia article on Super Bowl 50 received tens of thousands of hits, with some hours reaching 50,000. Over one million hits were registered in the 48 hours around the game,[1] adding even more pageviews to what was already the eighth-most popular article at the end of January; the article on the Super Bowl as an institution added over 500,000 more.
We obtained this data with the help of the Wikimedia Foundation’s Analytics team, and mined it to match up viewcount spikes with events during the game.
Players

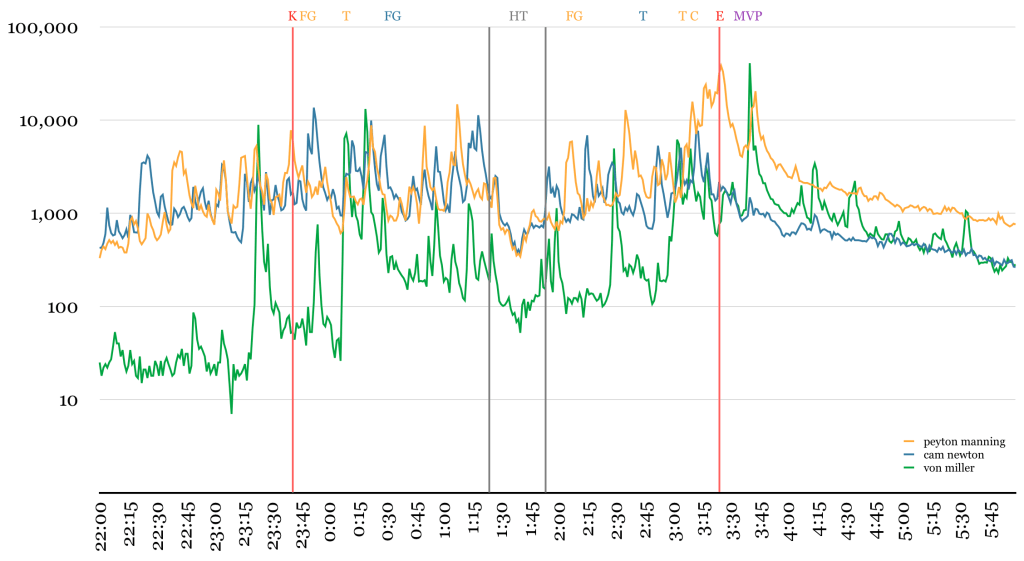
Players’ viewcounts were erratic and tended to match the flow of the game. You can click on these images for larger views; the times correspond with UTC, where 22:00 is 2pm PST and 5pm EST. Graph by Joe Sutherland, public domain.
Of the players we examined, the largest jump in pageviews for a player’s Wikipedia article came in the minute after Von Miller was named as the game’s MVP: 40,849 hits were recorded between 7:40 and 7:41 PST (11:40–41pm EST).
Overall, Miller’s game as viewed through the lenses of Wikipedia views was fascinating. Before the game, Miller rarely crested above 50 views per minute. He had one spike twelve minutes before the game, although we don’t know why—readers, please let us know if you have a solution. They soon settled back into a two-digit pattern …
… until he strip-sacked Newton in the game’s first quarter, knocking the ball out of his hands and into the arms of a waiting teammate for a Broncos score—that’s the spike you’ll see in the graph above between 0:00 and 00:15 UTC. At the time, the Panthers offense had gained a grand total of -6 yards.
Interest in Miller remained high after that, spiking several times—such as when he split a sack with teammate DeMarcus Ware at the end of the third quarter. Sustained interest took hold after Miller’s second strip-sack of Newton near the end of the game, jumped as noted when he won the MVP, and had a small bump long after the game when he appeared on The Late Show with Stephen Colbert live via satellite.
Miller finished the night with five solo tackles, two forced fumbles, and two and a half of his team’s seven quarterback sacks, playing a key role in putting pressure on Cam Newton on 21 out of 48 pass plays.
Denver’s quarterback Peyton Manning came close to matching Miller’s high-water mark at and after the end of the game (7:16–29pm PST), including one minute with 38,238 hits. He did, however, blow Miller out of the water in total views during the 7pm PST hour—Manning’s article was viewed 226,099 times, driven by those 13 minutes of five-digit attention.
We also looked at the matchup between the two starring quarterbacks, where Manning clearly beat out Carolina’s Cam Newton for views—Newton won the head-to-head matchup in only two hours and only by a total of 15,000 views. Manning cleaned up during the rest of it, besting Newton by 19,000 views in one hour and a whopping 169,000 in the next, which corresponded with the end of the game.
Newton had several early game view spikes, including after his first-quarter fumble and after he was sacked just before halftime.
All that said, the longer view is more nuanced.[1] Newton beat Manning in the pre-game 24 hours by about 46,000 views, but in the endgame/post-game thrill of victory, Manning won the succeeding 24 hours by over 904,000 views.
Halftime

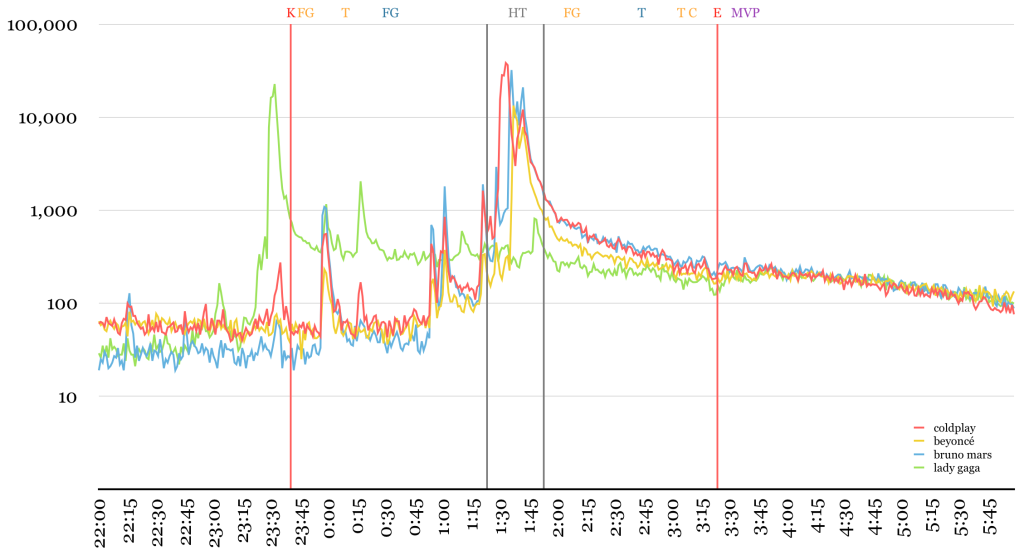
Thousands looked up the half-time performers as they took the stage in Santa Clara. Graph by Joe Sutherland, public domain.
The halftime performers received a good deal of attention at, unsurprisingly, halftime. Traditionally, featured artists have received quite a bump in sales from the tens to hundreds of millions of people tuning in.
Coldplay and Bruno Mars spiked at 38,149 and 32,029, respectively, in single minutes when they were singing, but no one this year approached a record number of views for a Super Bowl halftime show. Data from 2013 shows that halftime performers Madonna and the Who received nearly a million and 570,000 views (respectively) in the hours they performed—and it is almost certain that these numbers are understated, as at that time mobile phone views were not counted.
Up against these numbers, Coldplay managed only 417,516 for the day, much less in a single hour, where they received a maximum of 126,898 hits. Bruno Mars topped out at 94,347 in an hour.
That said, we have reason to question Beyoncé‘s figures: the much-anticipated appearance of the pop icon, who many news outlets thought ‘stole the show,’ did not result in anything close to a similar view count. Beyoncé’s article spiked at just 13,282 views and hit five digits in only one other minute. We don’t have a good answer for this discrepancy, as the difference is not made up by Wikipedia redirects or her choice of song; were people too entranced by the performance to look up her Wikipedia article, or did they simply already know who she was? Like Miller above, we’d love to hear readers’ theories.
In miscellanea, Lady Gaga’s sterling (albeit controversial, at least in the prop betting world) rendition of the US national anthem led to a ten-minute increase in interest in her from 3:29–39pm PST, including one minute of 22,663 hits. Michael Jackson, whose image appeared during halftime as part of a callback to past performances, had a small but notable seven-minute increase in traffic of his own.
Teams

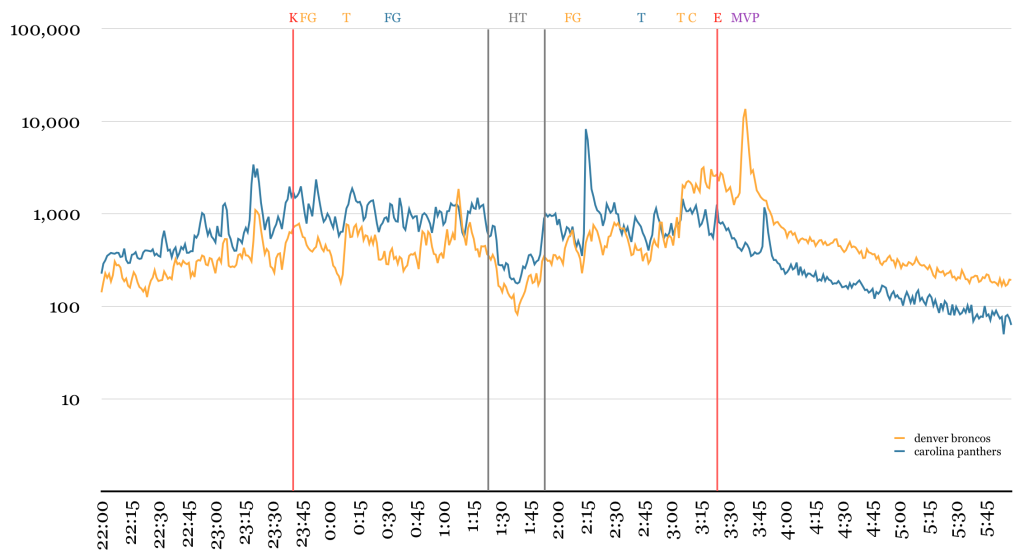
Both teams’ pages also attracted thousands of hits over the course of the night. Graph by Joe Sutherland, public domain.
Denver and Carolina also battled it out on their own Wikipedia pages. With an average of 1,283 views per minute over both the Denver Broncos and Carolina Panthers Wikipedia articles, people were clearly interested in the clubs’ histories as the game went on. Carolina had the higher average, at 661 views per minute to Denver’s 621.
With halftime came a big drop in visits for both teams’ pages, presumably as viewers focused on the eclectic show. The largest spike came for Denver as Miller’s MVP award was announced; 24,580 visitors arrived at the Broncos’ article in the two minutes that followed.
We’ve put all of the minute-by-minute Wikipedia pageview data in a Google spreadsheet; play around with it and let us know what you find.
Our thanks go to the Wikimedia Foundation’s Dan Andreescu, who compiled and tabulated this data for us despite having very little advance notice. This post would not exist without his assistance.
Ed Erhart, Editorial Associate
Joe Sutherland, Communications Intern
Wikimedia Foundation
[1] Wikipedia’s day ends at 12am UTC, or 4pm PST/7pm EST. This time change came sometime in the first quarter, so the per-game day-by-day views are split between February 7 and 8. We get into more detailed data later in the post.
This post was edited after publication to correct the source of our data.

Can you help us translate this article?
In order for this article to reach as many people as possible we would like your help. Can you translate this article to get the message out?
Start translation