
Results of the 2012 United States presidential election, shaded by voting share. Blue is for the Democratic Party, while red is for the Republicans. Map by Inqvisitor, freely licensed under CC BY-SA 3.0.
The race to become the next United States president is intensifying as the two main political parties, the Democrats and Republicans, are holding caucuses and primaries to determine who their candidates will be in the coming two-person general election.
Votes have already been held in Iowa, New Hampshire, South Carolina, and Nevada, and ‘Super Tuesday‘—named for the large number of states holding their votes that day—is today.
The voting process this year has been unusually charged, due in large part to real estate magnate, reality television star, and Republican candidate Donald Trump‘s rhetoric. He is facing Ted Cruz, a senator from Texas; Marco Rubio, a senator from Florida; and two other candidates, all hoping to gain the Republican nomination for the presidency. Trump is currently leading the field in terms of delegates, with Cruz and Rubio trailing.
On the other side, the Democrats have just two candidates—Hillary Clinton, the former secretary of state and senator, and Bernie Sanders, a senator from Vermont. The two are virtually tied in the number of delegates that are voted on from each state. However, many party figures also have a delegate vote, and by that measure Clinton is far ahead.
In this intriguing and compelling race, independent data analyst Eric Houston examined the 2016 presidential race between September 1 and December 31, a period that included eight Republican or Democratic debates. He used the Wikimedia Foundation’s public Pageview API and an associated R client package to crunch the numbers, and in doing so “analyse the impact that these debates have on traffic to Wikipedia and what users are interested in reading about.”
His results are below. We emphasize that any thoughts and opinions are his alone and do not reflect any position or view of the Wikimedia Foundation.
Initial constraints
I decided that the 92 day window from September 1 to December 1, 2015 was most appropriate for the following reasons:
- It included the 8 most important and interesting debates (4 Republican and 4 Democratic).
- The API would not give me data before September 1st.
I did, however, include graphs at the end of this post that show more recent shifts in the candidates’ view counts (from January 2016 to near the end of February).
I decided to begin my investigation by limiting the field of candidates to the five that most interested me, were getting significant media attention, and seemed to best represent popular interest:
- Donald Trump
- Bernie Sanders
- Hillary Clinton
- Ted Cruz
- Marco Rubio
Preliminary findings
The greatest one-day page view count went to Bernie Sanders by a mile (almost 100% more than #2 (Donald Trump)). It also showed Donald Trump clearly ahead in average page views (exactly equal to #2 (Cruz) and #3 (Rubio)) combined. Wikipedia readers seem to be interested in Donald Trump and Bernie Sanders!
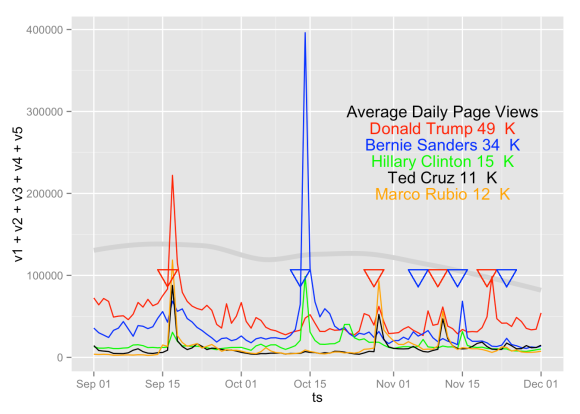
All five candidates

Red arrows represent Republican debates, and blue arrows represent Democratic debates.
These are the top five candidates by page views in the time period.
- The first Republican debate on September 16th sharply spiked page views for all five candidates.
- The initial Democratic debate on October 13th spiked page views for Bernie Sanders and Hillary Clinton.
- Page views for Donald Trump increased after the first Democratic debate, but page views for Ted Cruz and Marco Rubio were not significantly affected.
- After the second Democratic debate, the page view increase for Trump was much more pronounced than for Sanders or Clinton!
- The total daily page views trended downward several days after the first Democratic debate.
Zooming in on the Republican side
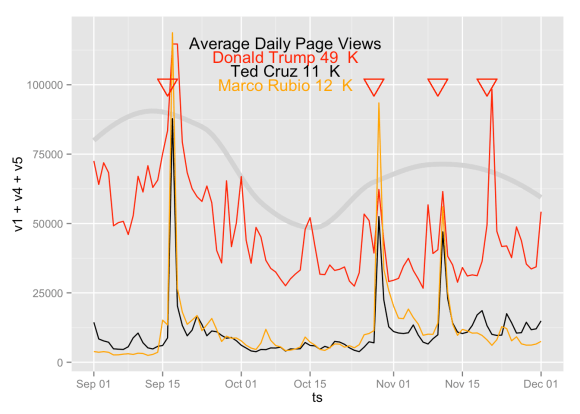
Red arrows represent Republican debates, and the gray line is an averaged total of daily page views. Please also note that the spike for Donald Trump on September 17 has been truncated to show additional detail, and the Y scale has been normalized for peak Marco Rubio views (120k).
Page views again spiked after the final three debates, and:
- Average daily page views for Trump exceeded (by a factor of two) the combined average views for Cruz and Rubio (i.e. 49K >> (11K+12K) * 2)!
- All three candidates have dramatically increased page views for the first three debates.
- Only Trump gets reader interest after the fourth debate. Cruz and Rubio are essentially unchanged.
Are Wikipedia readers losing interest or becoming informed?
And on the Democratic side…
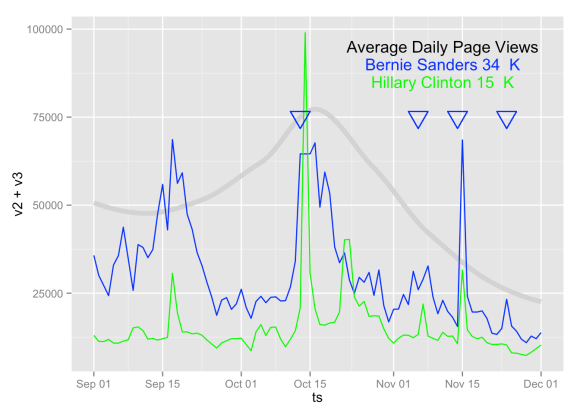
Blue arrows represent Democratic debates, and the gray line is an averaged total of daily page views.
- Sanders leads Clinton in average daily page views by more than 2 to 1.
- Sanders and Clinton clearly spike after the September 16th Republican debate.
- After the November 6th debate, Clinton spikes on the 7th—but Sanders doesn’t spike until the 8th. Odd.
- After the final (November 24th) Democratic debate, Sanders shows a clear spike, but Clinton actually trends downward. Most unusual!
- The total (Democratic) daily page views trends sharply downward after the first debate, as shown by the thick grey trend line.
Gauging viewer fatigue
Or are we learning? Did someone—or something—Trump the debates? Looking again at all five candidates, it is clear that the effect of presidential debates on page views has diminished with time. Comparing page views for the first Republican and last Democratic debates:
- Average page views for all five candidates before Oct 15th were higher than after Oct 15th.
- After the second-to-last democratic debate (Nov 14th): page views for all five candidates tell a very different story:
- After Nov 14th, average page views for Donald Trump trend upward.
- After Nov 14th, page views for the remaining three candidates trend downward. Conclusion: The effect of presidential debates on Wikipedia page views has declined substantially from Oct 16th to Nov 24th.
Republican vs. Democratic page viewing trends
When looking at the Republican and Democratic graphs:
- Averaged total page views for the Republican candidates are sustained through all four debates, but fall off noticeably between the first and second.
- The “Double Humped” averaged total page views for Republican candidates indicates that the Republican debates had an uplifting effect on Wikipedia page views.
- Averaged total page views for the Democratic candidates peak after the first debate, then decline steeply through the final three debates.
- The “Single Peaked” averaged total daily page views for Democratic candidates indicates that the Democratic debates did not create an uplift in Wikipedia page views.
It is not clear whether Wikipedia readers are Republicans or Democrats—but it is certainly clear that they have shown strong and sustained interest in Donald Trump.
More recent trends
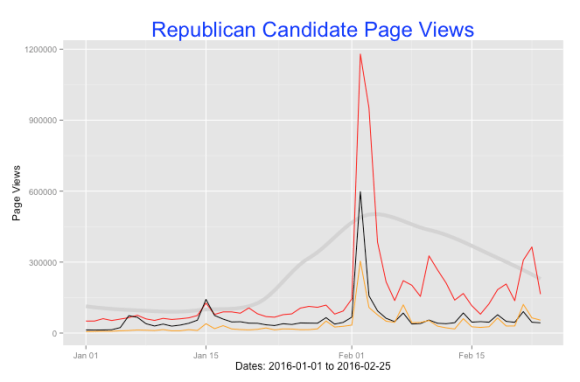
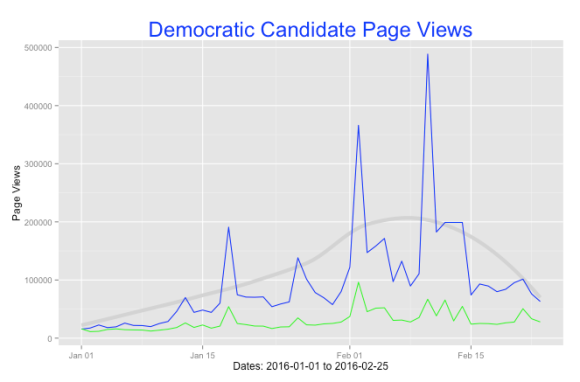
The huge spikes for Trump and Sanders were both one day after the Iowa and New Hampshire primaries, so the primaries are clearly driving traffic to the site, and I would expect that to continue.
The Republican spikes on Feb 2nd look proportional to the poll results, but the Democratic spikes on the 2nd are not at all. Even though the vote was a virtual tie, the Sanders site traffic exceeded Clinton by more than three to one—and Sanders won the New Hampshire primary by three to two, but his Wikipedia traffic exceeded Clinton’s by more than seven times.
So, for whatever reason, Sanders is getting a disproportionate amount of Wikipedia traffic after the primaries. This could be because Clinton has received extensive news coverage for twenty-five years, whereas Sanders is more of an unknown quantity and people are using Wikipedia to learn about him and answer questions that have not been answered for them by other media sources.
It is also interesting to note that Wikipedia traffic dramatically spiked after Iowa and New Hampshire, but noticeably less after Nevada and South Carolina.
Eric Houston, Business Analyst
All graphs courtesy of Eric Houston, freely licensed under CC BY-SA 4.0. We emphasize that any views expressed are Houston’s alone and do not reflect any views or positions taken by the Wikimedia Foundation.
Can you help us translate this article?
In order for this article to reach as many people as possible we would like your help. Can you translate this article to get the message out?
Start translation