One of the things I love about working for Wiki Education is the chance I get to mentor for Google Summer of Code and Outreachy. I’m especially proud of what Amit Joki has accomplished. Amit first started contributing the the Dashboard project (which powers both Programs & Events Dashboard and the Wiki Education Dashboard) in early 2018, hoping to be selected for Google Summer of Code that year. I didn’t select him that year, but he kept contributing — and I became more and more impressed with his work, and with his willingness to dive into just about any technical problem, no matter how hard it seemed. Selecting him for Google Summer of Code was an easy choice in 2019, and an even easier one this year. I’m really excited about the projects he tackled this year, which will be especially helpful for the thousands of editors who use Programs & Events Dashboard on mobile devices or limited-bandwidth connections. I’ll let him explain it!
-Sage
I am Amit Joki. I am currently in my final year of college. I was part of Google Summer of Code 2019 with Wikimedia and I was overjoyed when I came to know that I was going to work with the amazing folks (read: the best mentor anyone could get, Sage Ross) at Wiki Education once again as part of Google Summer of Code 2020.
In 2019, my project was something discrete. I could point you to the parts I worked on which weren’t there before and I could go, “Hey, see this feature? I worked on it!”
But it was going to be different this time around, for my project was abstract, something that could only be felt. My proposal was to improve the loading speed of the Dashboard.
The user experience for people with low-bandwidth internet was not up to the mark. There were lots of resources needlessly being downloaded which was making the website seem slow.
The problems were:
- Redundant resources were being downloaded.
- Some of the JavaScript libraries had bloated sizes.
- Some heavy resources which are only used by program organizers were downloaded by everyone.
The above problems were solved by:
- Extracting the common resources into a separate file and make all others refer it rather than have their own copy.
- Migrating to newer, leaner libraries, thereby significantly reducing the bundle size.
- Downloading certain resources only when they are needed and not all the time.
Now let’s talk some numbers. Before this project began, the overall size of the resources that were being downloaded on an average client’s browser was nearly 4.43 MB every time.
Now, after we have extracted all the shared code, it comes to 3.03 MB and there’s a further reduction of nearly 900 KB in the form of not loading the rich text editor TinyMCE for users who don’t need it.
So the final tally now comes up at near 2.13 MB — more than 50% reduction from the previous resource sizes.
On top of it, all the resources were being downloaded every time a new change is deployed — which is quite often. But now with the shared library code being put in a separate file, nearly 1.14 MB of the resources will be only needed the first time. The library code changes relatively rarely, so caching it separately saves another 1.14 MB if you’ve visited the site before. Altogether, these changes make the page loading experience faster for people with low-bandwidth internet.
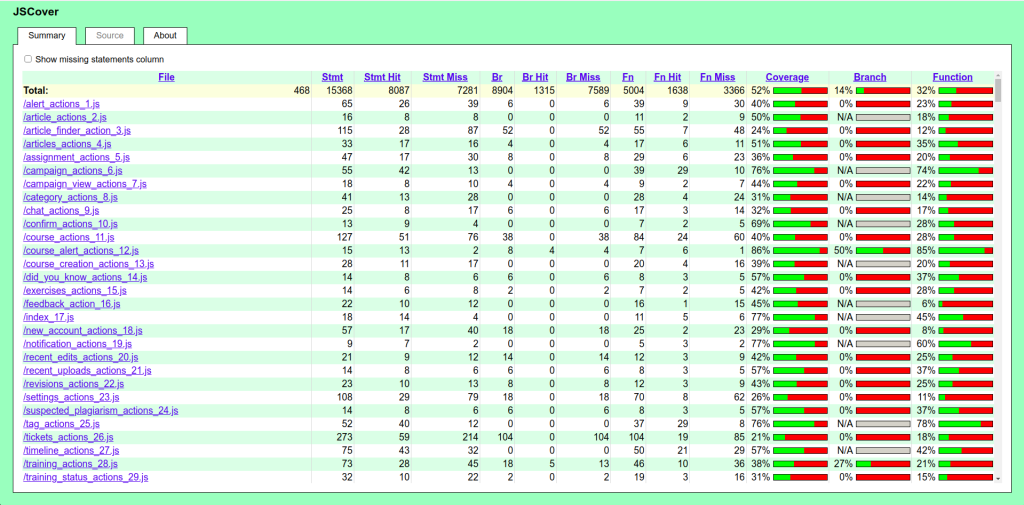
Another part of the work I did was to generate coverage report for the JavaScript. Coverage reports are extremely useful as they let you know how much of your code is covered by the tests, and identify the code that isn’t being tested — which therefore you might break without realizing it.
Generally, the higher the coverage, more robust an application becomes. But there weren’t well-documented ways of getting this JavaScript coverage data from the main type of tests the Dashboard relies on. After much searching and experimenting, I used JSCover, a Java tool to instrument the code and generate the coverage reports.
The initial version of the coverage did not prove to be too useful as it was done on a huge concatenated file. I tinkered around with the Webpack outputted files and managed to breakdown the modules into their own files.
The result is that we now have an extensive coverage report for each and every individual file, which is great!
On the whole, my time with Wiki Education Dashboard this summer has been an enriching experience. Sage Ross has been a wonderful mentor as always. I got to know other people within Wikimedia organisation. It has been one hell of a ride on the whole and I am thankful I rode the shotgun.
-Amit
Thank you, Amit! One hell of a ride, indeed!
Can you help us translate this article?
In order for this article to reach as many people as possible we would like your help. Can you translate this article to get the message out?
Start translation