Have you ever looked up a Wikipedia article about your favorite TV show just to end up hours later reading on some obscure episode in medieval history? First, know that you’re not the only person who’s done this. Roughly one out of three Wikipedia readers look up a topic because of a mention in the media, and often get lost following whatever link their curiosity takes them to.
Aggregate data on how readers browse Wikipedia contents can provide priceless insights into the structure of free knowledge and how different topics relate to each other. It can help identify gaps in content coverage (do readers stop browsing when they can’t find what they are looking for?) and help determine if the link structure of the largest online encyclopedia is optimally designed to support a learner’s needs.
Perhaps the most obvious usage of this data is to find where Wikipedia gets its traffic from. Not only clickstream data can be used to confirm that most traffic to Wikipedia comes via search engines, it can also be analyzed to find out—at any given time—which topics were popular on social media that resulted in a large number of clicks to Wikipedia articles.
In 2015, we released a first snapshot of this data, aggregated from nearly 7 million page requests. A step-by-step introduction to this dataset, with several examples of analysis it can be used for, is in a blog post by Ellery Wulczyn, one of the authors of the original dataset.
Since this data was first made available, it has been reused in a growing body of scholarly research. Researchers have studied how Wikipedia content policies affect and bias reader navigation patterns (Lamprecht et al, 2015); how clickstream data can shed light on the topical distribution of a reading session (Rodi et al, 2017); how the links readers follow are shaped by article structure and link position (Dimitrov et al, 2016; Lamprecht et al, 2017); how to leverage this data to generate related article recommendations (Schwarzer et al, 2016), and how the overall link structure can be improved to better serve readers’ need (Paranjape et al, 2016😉
Due to growing interest in this data, the Wikimedia Analytics team has worked towards the release of a regular series of clickstream data dumps, produced at monthly intervals, for 5 of the largest Wikipedia language editions (English, Russian, German, Spanish, and Japanese). This data is available monthly, starting from November 2017.
A quick look into the November 2017 data for English Wikipedia tells us it contains nearly 26 million distinct links, between over 4.4 million nodes (articles), for a total of more than 6.7 billion clicks. The distribution of distinct links by type (see Ellery’s blog post for more details) is as follow:
-
- 60% of links (15.6M) are internal and account for 1.2 billion clicks (18%).
- 37% of links (9.6M) are from external entry-points (like a Google search results page) to an article and count for 5.5 billion clicks.
- 3% of links (773k) have type “other”, meaning they reference internal articles but the link to the destination page was not present in the source article at the time of computation. They account for 46 million clicks.
If we build a graph where nodes are articles and edges are clicks between articles, it is interesting to observe that the global graph is strongly connected (157 nodes not connected to the main cluster). This means that between any two nodes on the graph (article or external entrypoint), a path exists between them. When looking at the subgraph of internal links, the number of disconnected components grows dramatically to almost 1.9 million forests, with a main cluster of 2.5M nodes. This difference is due to external links having very few source nodes connected to many article nodes. Removing external links allows us to focus on navigation within articles.
In this context, a large number of disconnected forests lends itself to many interpretations. If we assume that Wikipedia readers come to the site to read articles about just sports or politics but neither reader is interested in the other category we would expect two “forests”. There will be few edges over from the “politics” forest to the “sports” one. The existence of 1.9 million forests could shed light on related areas of interest among readers – as well as articles that have lower link density – and topics that have a relatively small volume of traffic, making them appear as isolated nodes.

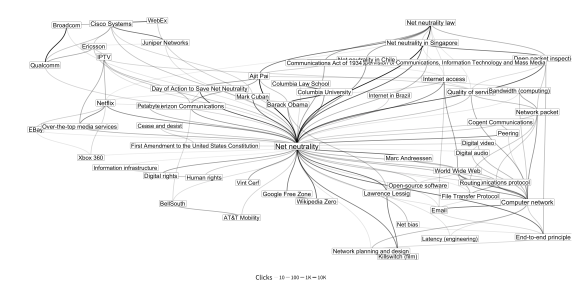
Using the igraph library together with ggraph, we can obtain a list of articles linked from net neutrality, treat that neighborhood of articles as a network, and then visualize how those are connected by the number of clicks and neighbors. Data visualization by Mikhail Popov/Wikimedia Foundation, CC BY-SA 4.0.
If you’re interested in studying Wikipedia reader behavior and in using this dataset in your research, we encourage you to cite it via its DOI (doi.org/10.6084/m9.figshare.1305770) and to peruse its documentation. You may also be interested in additional datasets that Wikimedia Analytics publishes (such as article pageview data) or in navigation vectors learned from a corpus of Wikipedia readers’ browsing sessions.
Joseph Allemandou, Senior Software Engineer, Analytics
Mikhail Popov, Data Analyst, Reading Product
Dario Taraborelli, Director, Head of Research
Did you enjoy that net neutrality data visualization? Find out how you can do it.

Can you help us translate this article?
In order for this article to reach as many people as possible we would like your help. Can you translate this article to get the message out?
Start translation